Raising the Bar in Survey Design with Enalyzer’s AI Surveys

Creating a compelling survey demands precision—each question and corresponding response option must be meticulously aligned with the survey’s overall purpose,…

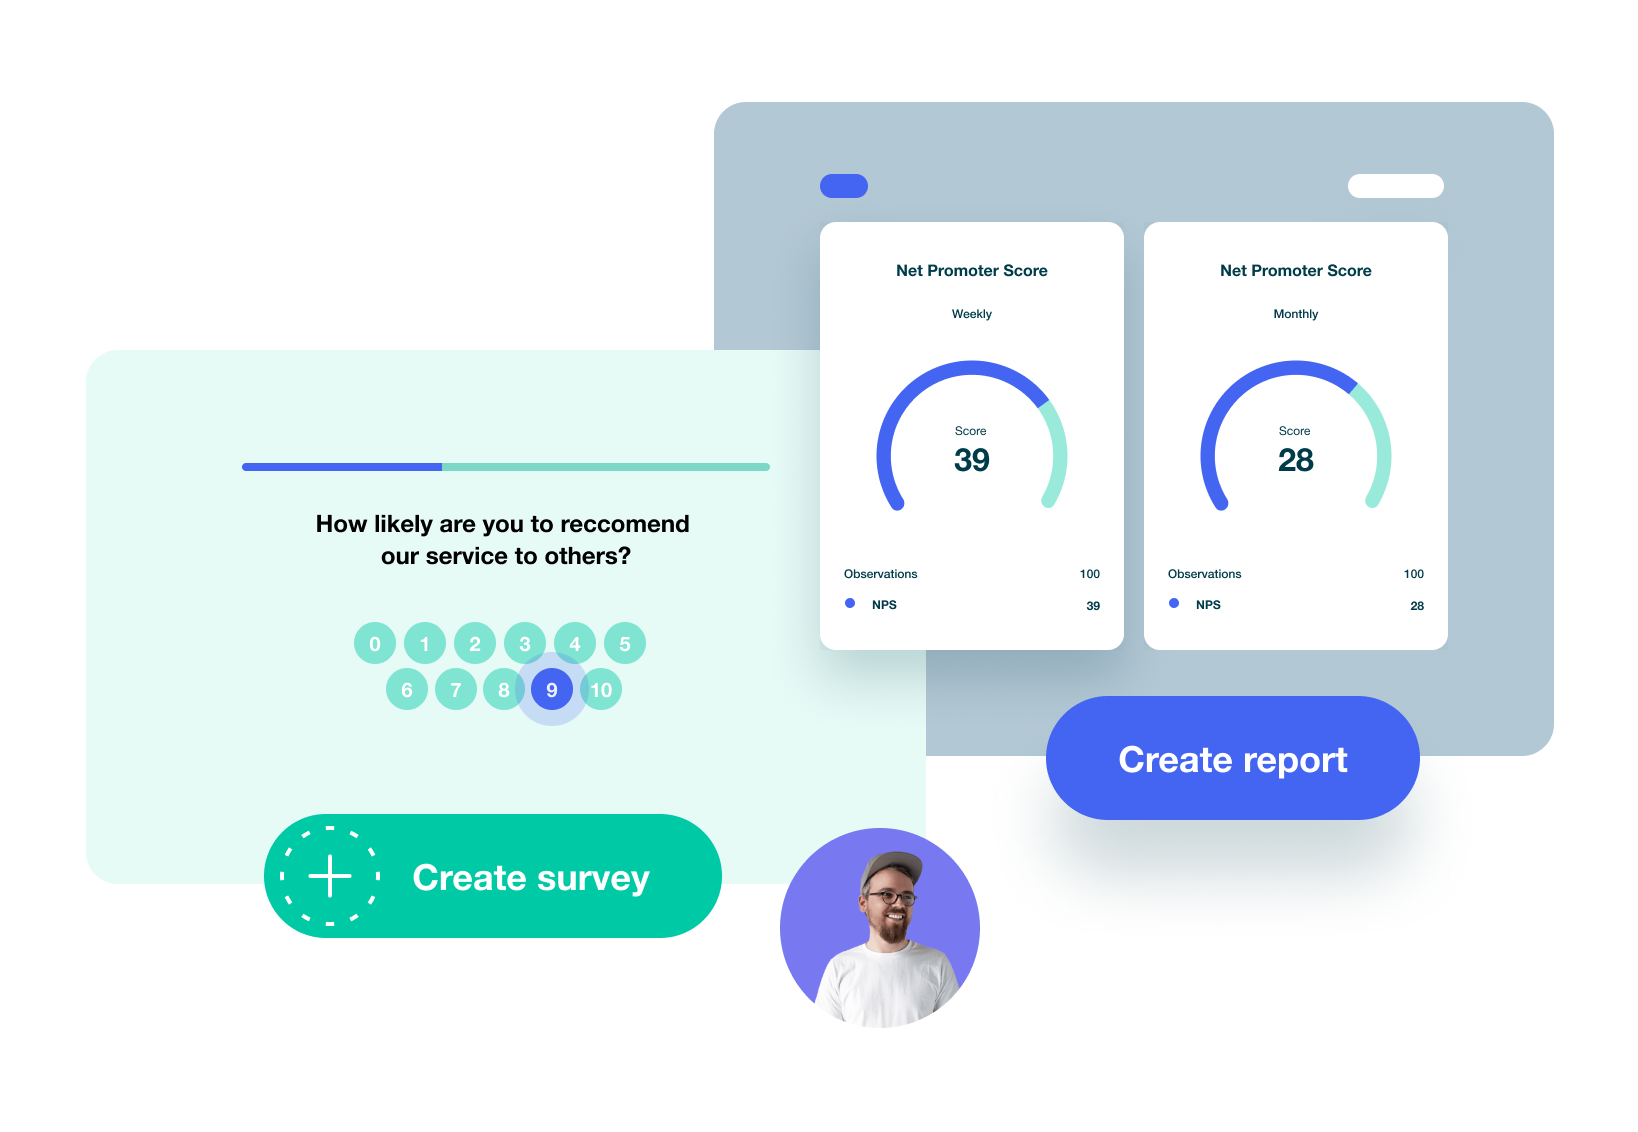
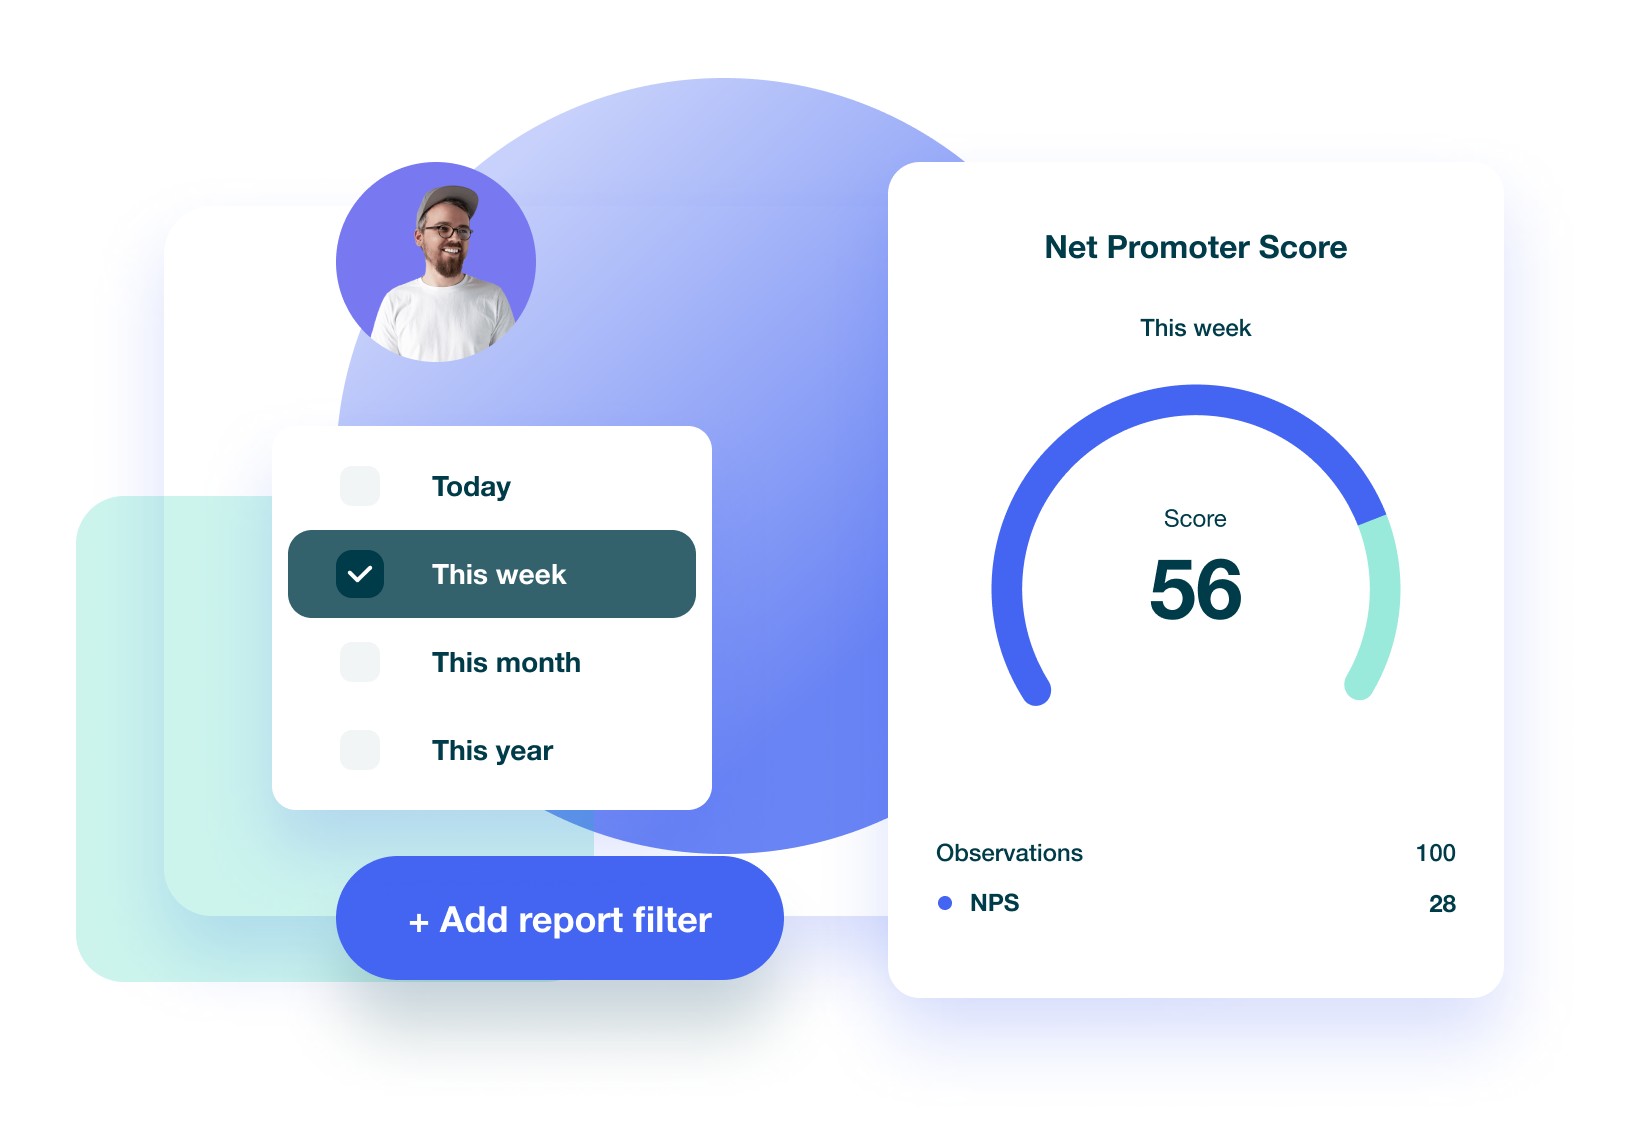
Creating a compelling survey demands precision—each question and corresponding response option must be meticulously aligned with the survey’s overall purpose, research questions, and hypotheses. Done well, this process will offer a robust survey that provides valuable insights. On the other hand, a poorly constructed survey will fall short in delivering useful data. Imagine, then, if you had someone—or something—guiding you through this intricate maze, almost like holding your hand through each decisive turn. Enter Enalyzer’s new AI assistant, powered by OpenAI, designed to guide you through the survey design process.

📣 Upcoming Webinar: Unlock the Full Potential of Enalyzer’s AI Assistant

Excited about what our AI assistant can do for your survey design process? Join us in our exclusive webinar, ‘Design and Build Surveys Effectively with Enalyzer’s AI Assistant.’ Hosted by Henrik Nielsen, our Head of Research, this session will be a deep dive into leveraging the AI assistant for effective surveys. Reserve your seat now and transform the way you design surveys.

Join the webinar in English:

Join the webinar in Danish:

At Enalyzer, our mission is to empower everyone to create impactful surveys that drive organizational improvement. We recognize that not everyone has the expertise to design an effective survey. Inexperience often leads to overlooked aspects, jeopardizing data quality. That’s where our AI assistant steps in, offering tailored guidance at each step, making the process less daunting and far more effective.

The Intersection of AI and Human Expertise

As AI technology becomes more integral to our daily lives—75% of employees use ChatGPT at work, for instance—we wanted to offer something more than just a standalone AI tool. Our aim is to encapsulate the sense of security and support your experience when consulting with our team members, from customer support to project managers. To this end, we introduced an AI assistant, powered by OpenAI.

This assistant guides you during the survey creation process, asking questions along the way to ensure that your survey is not just personalized, but also aligned with the crucial metrics and themes you aim to explore. Since it’s already integrated to Enalyzer, the survey will be created directly into the platform with a click of a button.

Tailored Assistance

What sets Enalyzer’s AI surveys apart is the focus on customization. By aligning your specific needs and objectives into the survey design, you get a tool that is perfectly tuned to your organizational requirements. This is not a one-size-fits-all approach; it’s about crafting a survey that is as unique as your project’s goals.

If you’re uncertain about what those objectives should be, worry not. The assistant is designed to help you brainstorm, asking probing questions to help clarify your goals. The more information you provide, the more refined your survey will be.

Collaboration Over Automation

Our AI assistant is a guide, not a dictator. You know your organization best so diverging from the assistant’s suggestions when they don’t seem to fit is not only welcomed but encouraged. Such collaborative efforts will most likely yield a more effective survey.

The assistant aids in defining the survey’s scope, advising on question types, and suggesting refinements, making the entire process more interactive and insightful.

We wanted to create an assistant that was, just like our support agents and consultants, an expert in Enalyzer. The assistant can translate your unique needs into Enalyzer-specific features. Our goal is to continually learn from our users to enhance both the assistant and the overall Enalyzer experience.
– Steen Ødegaard, CTO.

Best Practices for Engaging with the AI Assistant

Input quality determines output quality. While the AI assistant alleviates much of the manual work, it’s essential to remember that unclear or vague input will result in an equally unclear survey. Henrik Nielsen, our Head of Research, offers these best practices:

  • State Your Survey’s Purpose: Be clear about why you’re conducting the survey (e.g., to reduce employee turnover).
  • Describe Your Objectives: Specify what you wish to learn (e.g., insights into employee satisfaction regarding salary, benefits, workload, and culture).
  • Contextualize: Let the assistant know who is sending out the survey (e.g., we’re a pension and insurance company).
  • Be Detailed and Specific: Clearly state the outcomes you desire, the more specific you are, the more specific your survey will be (e.g., comparing employee satisfaction by department).
  • Avoid Ambiguity: Strive for precision to ensure your survey is equally precise.
  • Include Your Hypotheses: If you have assumptions or theories, like employees leaving due to lack of development opportunities, include them for testing within the survey.
  • Seek Additional Themes or Questions: Don’t hesitate to ask the assistant to suggest other crucial themes or questions pertinent to your survey.
  • Address Blindspots: We all miss details sometimes. Ask the assistant for any suggestions on questions or themes you may have overlooked to get a more comprehensive survey.
  • Assert Your Authority: You understand your organization’s context better than anyone. If you find any formulations, response options, or scales that don’t align with your insights, inform the AI assistant for necessary adjustments.
  • Pilot Test: Before fully launching your survey, always conduct a pilot test to gauge its effectiveness and make any final tweaks.

AI gives you superpowers – but AI is not an answer key. Always remember to go through the questionnaire AI suggests and use your common sense and critical thinking, and check that the questions align with your purpose and research hypotheses
– Henrik Nielsen, Head of Research.

Enalyzer’s AI assistant has the potential to significantly aid in the creation of thoughtful and effective surveys. It’s not just about automating the process, but about fostering a collaboration between you and the technology. This is how we believe we can best help organizations gather data that is actionable. Don’t miss the opportunity to elevate your survey design process.

Upgrade Your Lead Generation With Enalyzer Webhooks

Lead generation is critical for any business, but let’s face it, managing the process can be a real hassle. With…

Lead generation is critical for any business, but let’s face it, managing the process can be a real hassle. With Enalyzer, you can streamline your lead generation workflow and save valuable time and resources.

Webhooks are automated scripts that help integrate different systems. In this case, Enalyzer’s outgoing webhook feature makes it simple to send incoming leads from your Enalyzer survey straight to any external lead management systems. This means you can focus on what really matters – closing those sales!

Ready to try it out? Here’s how Enalyzer’s outgoing webhook helps you enhance your lead generation.

Captivate leads from the start

Get people’s attention with Enalyzer’s high-end, engaging, and mobile-friendly survey experience. If you’re not sure where to start, use one of our lead generation templates, such as the Meeting Booking Form or NewBizz Pre-Sales Meeting. You can easily customize them to fit your brand, needs, and most importantly your audience!

Location, Location, Location

Drive traffic to your lead generation form by placing it on your website. Enalyzer makes it easy to add your form as a pop-up, button, or standard embed. You can also generate leads through Google AdWords and direct traffic to your form.

Follow-up quickly

Speed is key when it comes to lead generation. Enalyzer’s outgoing webhook allows you to send real-time notifications to your sales agents on Slack or Microsoft Teams every time a lead completes your form, allowing your Sales team to act fast.

It also eliminates manual work by automatically sending lead information to all relevant external tools, such as your CRM, Google Sheets, and sales management tools. The integration possibilities are endless, your only limit is your imagination.

Setting up the webhook is simple. You can decide to transfer all survey variables and questions or a selected few, add a push URL where the data should be posted, test your connection, and voila! The transfer of information is secure, ensuring the privacy and protection of your valuable data.

Analyze your leads

Gain insight into your leads with Enalyzer’s custom reports. Analyze the collected data to determine the best leads and optimize your lead generation strategy.

Enalyzer’s outgoing webhook integrates seamlessly with your existing tools, making it easy to automate the transfer of survey responses and supercharge your sales process.

Best practices for lead generation

Here are a few best practices to keep in mind:

  1. Follow up promptly with leads to increase the likelihood of closing a sale.
  2. Personalize your approach to build trust and differentiate yourself from competitors.
  3. Test different lead generation strategies to find what works best for your business.

Ready to try it out? Give Enalyzer a go and see how it can help you generate more leads and streamline your sales process.

Streamline Employee Exit Interviews with Enalyzer’s Webhooks

Employees come and go, but their knowledge shouldn’t have to leave with them. Exit surveys are an important tool to…

Employees come and go, but their knowledge shouldn’t have to leave with them. Exit surveys are an important tool to help employers understand why employees are leaving and what they can do to improve. But let’s face it, exit interviews can be time-consuming and tedious.

Enter Enalyzer’s webhooks. We can help streamline your exit interview process and provide valuable insights into your employees’ experiences.

💡 Get started with our ready-to-use Employee Exit template.

Effortless Automation

Webhooks allow you to pass real-time information between applications. In the case of exit interviews, Enalyzer’s webhooks allow you to automatically trigger exit surveys and send the data directly back to your HRM system, streamlining the process and saving you time.

Here’s a scenario: you’re the HR manager at a tech company. When an employee resigns, an incoming webhook triggers an exit interview survey. The employee will receive an email with a link to the survey, where they can provide feedback on their time at the company.

Once the survey is completed, an outgoing webhook sends the data directly to your HRM system, keeping all the information in one place.

The Benefits

Using webhooks with Enalyzer’s exit interviews has several advantages.

Save Time: No more manual send-outs or waiting until the end of an employee’s tenure to conduct an interview. With webhooks, you can gather feedback as soon as an employee resigns.

More Data: By triggering exit interviews automatically, you can gather feedback from a wider range of employees, including those who may not have been selected for a traditional exit interview.

Analyze and Take Action

To fully understand why employees are leaving, you need to analyze and follow up on the data you collect from exit interviews. Enalyzer’s reports make it easy to drill down into the results and identify trends and areas for improvement. With this information, you can make informed, data-driven decisions to improve the employee experience and reduce turnover.

Learn how to use our incoming and outgoing webhooks.

Say goodbye to manual exit interviews and hello to insights and efficiency with Enalyzer webhooks.

Revolutionize Your Business with Surveys and Webhook Automations

Webhooks have transformed the way businesses automate workflows and streamline processes. When it comes to surveys, webhooks can significantly enhance…

Webhooks have transformed the way businesses automate workflows and streamline processes. When it comes to surveys, webhooks can significantly enhance the survey experience for both businesses and respondents. We are thrilled to introduce two webhook automations: an incoming webhook that triggers a survey invitation to a respondent and an outgoing webhook that sends the survey responses to an external system. Let’s dive into the benefits of pairing up webhooks with surveys to elevate your business.

Automated Survey Invitations

Incoming webhooks enable you to automatically trigger survey invitations in real time based on specific events, saving time and effort. For example, you can send a customer satisfaction survey immediately after a customer makes a purchase. This allows you to collect valuable customer feedback while the experience is still fresh in their mind, and eliminates the need for manual triggering.

Customized Experience

Enalyzer allows you to personalize surveys and survey invitations with merge fields, adding respondent-specific information to invitations. For example, for an entry employee survey, you are able to populate the survey and invitation with relevant employee data such as first and last name, department, manager name, and more. With incoming webhooks, you can feed in data and merge it into the survey and invitations, creating a more personalized and engaging survey experience for your respondents.

Integration With Other Tools

Outgoing webhooks allow for the automatic transfer of survey answers to an external system in real-time, streamlining the data collection process and saving time and effort. You can integrate with some of your favorite software such as Pipedrive, Salesforce, Trello, Power BI, Slack, and more. This allows you to work with the data you need when and where you need it.

Workflow Inspiration

CRM: Using Salesforce, Pipedrive, or other CRM systems? Set up an outgoing webhook to automatically send customer satisfaction survey responses. This allows you to keep track of customer feedback directly in your CRM and use it to inform sales strategies and customer service initiatives.

Online Businesses: An online business can set up an incoming webhook to trigger a customer satisfaction survey immediately after a customer makes a purchase. The survey invitation can include the customer’s name and order details, providing a more personalized survey experience. The responses from the survey can then be sent to an external system such as your CRM for further analysis and use.

Instant Messaging: Are you using Microsoft Teams or Slack? Then you can set up an outgoing webhook to automatically post survey responses to a channel. This allows the team to quickly view and discuss the survey results without having to log in to another platform.

Event Management: Use a registration form survey to register event participants. With the outgoing webhook automation, you can send the registrations to an external project management tool to automize your registration process. You can also set up an incoming webhook to trigger a satisfaction survey to participants immediately after an event has taken place.

Employee Pulse Surveys: HR departments can use incoming webhooks to trigger an employee experience survey each quarter directly from the HRM. The webhook can be set up to automatically send out personalized survey invitations to all employees as soon as the quarter ends. This eliminates the manual effort of sending out the invitations and ensures that the survey is sent out in a timely manner.

By using webhooks with surveys, businesses can take advantage of these numerous benefits and streamline their survey processes. With the real-time triggering of survey invitations and automated data transfer, businesses can make data-driven decisions and gain valuable insights into their operations. Whether you’re a small business or a large corporation, Enalyzer’s webhook automations offer the tools you need to enhance your survey experience and make the most of your data.

Ready to revolutionize your business with webhook automations and surveys? Sign up for Enalyzer today and start automating your surveys in minutes or contact our team of experts and outsource the entire thing.

Governments are easing up regulations, are you ready to follow suit?

As the spread of the coronavirus slows down, Europe is cautiously trying to get back to business with restrictions loosening…

As the spread of the coronavirus slows down, Europe is cautiously trying to get back to business with restrictions loosening across the continent. Denmark is opening up their shopping malls, The German Spy Museum in Berlin opened its doors for the first time in weeks, and Austrians can head over to hairdressers in Vienna after two months of lockdown.

With many European countries relaxing some of their restrictions, many are returning to public life. It’s a slow change and many restrictions will remain for the coming months. So, does this mean that your employees should slowly come back to the office? Hold your horses.

Health and safety first

Whether your employees have been working remotely or staying home due to business closure or health concerns, you need to ensure a healthy and safe transition back to the office. In other words, you need to determine when and how you can call back the troops.

We have developed a pulse survey solution that helps HR, IT, Operations, and Leadership teams address each employee’s unique needs and concerns to make a safe and positive transition back.

Pulse surveys collect real-time feedback, are flexible and adaptable, which allow the addition and removal of questions based on previous measurements. They allow for a proactive system that adapts to your employees and their experiences.

The Return to Work Pulse Solution

Our solution helps organizations quickly understand and address the employees’ unique concerns and needs to create actionable plans for transitioning teams back into the workplace.

Pre-built assessment questions and an automated point-in-time report cover the following topics:

  • Health and safety needs
  • Company and manager communication requirements
  • Readiness to reintegrate

This solution can be used for planning the reopening, as well as readying the organization, teams, and managers for a variety of situations including:

  • Employees returning back into the workplace after an extended period of remote work
  • Employees returning to work from extended self-quarantine or personal health safety concerns
  • Employees who interact with the general public and/or customers and are returning onsite

With our reports, you can use real-time employee experience data to make the best plans for your organization — and your employees — as you transition back to the workplace.

Are you interested?

Our consultants are ready to help you get through this. Book a demo.

If you’d rather handle it on your own, you can! We have a template you can use for inspiration and implement your own pulse solution using Enalyzer.

Monitor employee engagement and satisfaction frequently with the new organization features

Monitoring employee engagement and satisfaction requires consistency and this can be time-consuming for managers. With our new feature release of teams and employee…

Monitoring employee engagement and satisfaction requires consistency and this can be time-consuming for managers. With our new feature release of teams and employee profiles, you can empower your managers to collect and analyze feedback with just a few clicks. Reading time: 3 min. 

It’s impossible to not be part of a team. Teamwork combines different skills, approaches, and ways of thinking. Teams that know how to work together are great assets to companies since they help achieve results, however, when a team doesn’t operate like a well-oiled machine, it can cause delays in delivery, decrease in morale and strategic failure. 

If we look globally, companies are redesigning their organizations to be more team-centered which means teamwork isn’t going anywhere, so it’s important for you and your company to know have the tools you need to assess the strengths and weaknesses of teamwork in your organization. 

Teamwork efficiency and collaboration can be affected by a number of factors from changes in work tasks, team members or employees’ personal lives. Therefore, monitoring teamwork engagement and efficacy requires constant measuring. Well-designed surveys that have a strong theory-based framework and account for the goals and objectives of your organization will yield the data you need to take action. We promise you. But, and it’s a big but, that will not bring about real change unless you empower your managers with the right tools so they can do their work.  

That’s why we released employee profiles and teams. 

This platform update allows your managers to continuously and easily assess their employee engagement and team performance. Whenever they need to collect feedback, they simply pick the team that needs assessment, import the background information already stored and invite their employees with just a few clicks.  

The employee background information stored allows every single manager to slice and dice through the collected feedback to understand and identify problem areas, giving them the information they need to keep employees happy, engaged and for teamwork flourish. 

First things first, have you met Enalyzer organizations? 

Organizations allow you to have all your company’s employees, data and content under one online roof and not distributed throughout individual employee accounts. Everything created within the organization will always stay there and can never be transferred out, since leaving an organization means leaving all the work you’ve created behind. In short: organizations keep your company’s data in one place and protects it from employee turnover. 

Integrate your organization with Azure Active Directory (AAD) and automatically add all your employees to your organization. This provides them with single sign-on (SSO) which adds security to your organization and convenience to your employees. Plus, organization members will be automatically added or removed based on their AAD membership. 

Now it’s time to organize employees in teams 

Whether your organization adheres to conventional or dynamic hierarchies or a flat structure, we can accommodate to your structure. With Enalyzer, you can create teams that reflect your organization and use them to group your employees. Teams work with a hierarchy structure, that allows you to create teams within teams and you can use this structure to collect feedback as well. 

All employees have employee profiles with various background variables, so when you invite a team, you can import all employee variables. 

Add your employees and set up their profiles  

You can add any and all organization members as employees so you can easily collect their feedback and you can customize employee profiles. Employee profiles consist of their background information, aka demographic data that you can customize. You get to decide which variables these profiles contain, e.g. age, gender, salary, manager and more. Instead of manually setting up a CSV every time you conduct a team or employee survey, you can just import the data stored in the employee profiles. And, of course, all employee background information can be used to segment, benchmark, and drill down into your data when you analyze the collected feedback. 

With our quick results summary report, managers can also get a quick overview of employee feedback. If you’re not sure where to start, we created a template for you!

→ Use our teamwork evaluation survey template 

10 Best Practices for Better Enalyzer Reports

Reports are crucial for any measurement, however, if set up improperly, they can confuse and even misguide readers. In short,…

Reports are crucial for any measurement, however, if set up improperly, they can confuse and even misguide readers. In short, mistakes in the report setup might not make sense to those who need it the most. Nevertheless, well-thought-out reports can quickly deliver insights, as well as discover patterns in your survey data.

To help you bring data to new levels, we have compiled 10 things to keep in mind when designing Enalyzer reports to maximize the return on your reports. But first things first…

The quality of your report is defined by your survey. To achieve a quality report, you have to start with a survey that has a clear purpose in the form of goals and objectives, formulate unbiased and clear questions, and have a response rate that is representative of your target audience. Great, now that it is out of the way, let’s move on to our 10 tips for building better reports!

1. Share your report for a higher response rate

One of the main goals for any survey is to get a high response rate and sharing your report with respondents is the best way to reach this goal. When you share your survey with your respondents, it’s a good idea to share your report as well. Sharing survey results is one of the best ways to increase participation. For example, for B2B customer surveys, account managers can share the results with their customers, since they already have a relationship, and it can push customers to leave their feedback. As for employee surveys, you can nudge your employees to leave their feedback by showing the results divided by department, this can create a small competition which unquestionably will lead to a higher response rate.

2. Your survey sets the tone

Your survey’s audience and frequency have a direct influence on your report setup, anonymity, distribution, and maintenance. Let’s take Customer vs. Employee surveys as an example.

Readers: The first thing that is already decided by your survey is the report audience, aka the readers. For customer surveys, the account managers are the ones that need insights to improve and better understand the customer experience, whereas, for employee surveys that responsibility falls under HR and/or managers.

Filters: The readers define the filter setup of your reports. Employee reports operate with closed filters so that department managers can only access their feedback and no other department results. On the other hand, customer reports can have open filters that can help you filter down to very specific customer groups and view specific results.

Anonymity: We recommend that employee surveys have an anonymity level of 5 completed responses to protect employee anonymity. In other words, data will not be shown unless there are at least 5 completed responses, this will make it impossible for managers to pin-point individual employees, as well as ensure confidentiality. If employees know their feedback will be handled carefully, they will be more likely to provide honest feedback.

3. Define your readers

Reports are meant to be presented to someone; they have an end-user which means you need to have their needs in mind when creating reports. Once you have your readers in mind, ask yourself the following questions:

  • Are they used to working with data in general?
  • How do they normally interact with data?
  • How detailed should the data be presented?
  • How much guidance should the reader have?

If your readers are used to working with data, they can easily navigate detailed reports. However, if the opposite is true, you might want to opt for focusing on averages to show key findings and metrics. Some readers need more guidance than others to get them through a report. This can take the form of texts summarizing key results and highlights, color intervals in charts to illustrate areas of improvement, and more.

The point is to think about who will be reading the report, their preferences, and their needs. Once you have this, the report setup will be a breeze.

4. Be consistent

The purpose of any report is to provide insight and for this to be done effectively, the information needs to be presented consistently. Readers will understand the information, discuss it, and make effective decisions based on what they see. This repetitive and consistent approach allows readers to move beyond understanding the data and begin interacting with the information.

What do we mean by a repetitive approach?

The first image is a mix of charts and color themes that looks messy and confusing. Readers will have to put an extra effort into understanding what’s being presented to them. However, if we look at the second image, we can see a pattern. Overall themes are illustrated with gauges, and sub-questions are presented with average bars, as well as stacked bars to show the distribution of responses and a color theme that clearly illustrates whether the responses are positive or negative.

In other words, the repetitive approach needs to follow a certain logic when it comes to your chart types, the terminology used, color themes, and the report layout.

5. Keep a structured layout

This tip goes hand in hand with the repetitive approach. Structure your report with sections to increase readability. Report sections should also be structured not only in terms of content, as we went through previously but also columns and layout.

6. Group and compare data with data series

Data series are for those who want to venture into complex reporting. A data series is a grouping of data based on one or more filters. You can plot multiple data series in a chart for comparison or benchmarking purposes.

Benchmarks give you an easy way to compare your results across departments, countries, years, and other variables. It a way of providing your results with context and understanding where your organization stands. With the Enalyzer data series function, you create the benchmarks, giving you full control over the entire process.

7. Filter out partial responses

Some include partial responses, which means respondents that did not finish the survey. However, over at Enalyzer, we recommend that you only work with completed responses.

Partial responses are incompatible with quota sampling and weighting because the base fluctuates across all questions. Moreover, it can be confusing to readers when the total number of responses changes across the report.

Finally, you never really know why a respondent left a survey. While it could be that they ran out of time, it could also be that the respondents wanted to review the survey before answering, which means you risk ending up with random data. This scenario invalidates and corrupts your data. Why take the risk?

Excluding partial respondents in Enalyzer reports is simple, just add a closed filter based on response status and select “completed”.

8. Guide the readers

Humans can’t process too much data at a time without getting overwhelmed. Getting overwhelmed leads to decision fatigue which makes it harder for your readers to think strategically. Consequently, you should help your readers by highlighting certain key metrics on the front page, especially if your report consists of multiple sections and charts.

Top/Bottom charts are brilliant for guiding readers and directing focus on what matters. Top/Bottom charts visualize the strongest and weakest data points which allow the reader to understand what is working and/or what needs improvement. You can supplement this by asking respondents which themes are most important to them, if any of them are part of the “bottom”, then you know where to direct reader focus.

9. Scale with report templates

Most of the time, you’ll be creating different reports for different readers, for example, a report for direct managers can look different from a report for top management. For that reason, we recommend that you create a report template that you can scale and save a huge amount of time.

We recommend you pilot test your report before you scale it up. A pilot test could involve sending it to key personnel and/or people part of your reader target audience and get feedback before you scale your report template into the full deliverables.

What’s even better is that with Enalyzer you can share report templates with your entire organization. When you share surveys as templates, you can choose to include reports as well. This will save your colleagues tons of time.

10. Practice makes perfect

As with many things, building reports is something you learn by doing. Remember that context is key, so ask yourself the following:

  1. What type of survey?
  2. Who are the readers?
  3. How are you going to distribute it?

The best way to start is to play around and get the first section ready, after that you can use our edit in bulk function to get through the remaining sections quickly.

Enalyzer Reporting: Turn data into insight

Surveys, reports, and insight are in a symbiotic relationship. They cannot exist without each other, at least not in a…

Surveys, reports, and insight are in a symbiotic relationship. They cannot exist without each other, at least not in a way that brings value to your company. Today we’re going to highlight reports but never forget that one cannot exist without the other. 

Reports help you visualize and understand the survey data that you can share with whoever needs to see it so that everyone makes informed decisions.

Sounds advanced? It’s not, because with Enalyzer anyone can be an analyst. You can create customized reports that tell a story and share it with relevant stakeholders, without any experience.

alt_text

Let’s Break It Down

A report is greater than the sum of its parts but let’s talk about those parts and their benefits.

REPORT CHARTS
Charts are a report’s cornerstone because they visualize data. Different charts address different needs and the correct combination will get you the insight you need.

REPORT FILTERS
You can filter reports by answers, time, and any survey background variable, e.g. age, department, unit, company, and more. Filtering and drilling down into your data gives you a better understanding of the state of your business. 

Enalyzer Report Filters

GROUP AND COMPARE DATA WITH DATA SERIES
Create data series (a grouping of data based on one or more criteria) and add them to a chart for comparison or benchmarking purposes. This gives you an easy way to compare your results across departments, countries, and other variables.

REPORT SHARING & VERSIONS
With Enalyzer you can share your reports securely with others and provide them with read-only access. To ensure the right data gets to the right people, you can create different versions of the same report and share them.

The ABCs of Reports

In this 30 minute session, you will learn the basic chart types, filtering options, and other tricks to kickstart your online reporting journey.

Advanced Reporting Techniques

In this 30 minute session, you will learn how to set up reports like an expert. We’ll review advanced chart types, e.g. time series. Define variables, set up data series, as well as sharing report versions for limited access to your reports.

Why stop there? There’s more

We’ve compiled a list of webinars to help you get started with Enalyzer and give you a closer look at the multiple features available for your surveys and reports.

NEED HELP SETTING UP REPORTS?
If you would like a team of experts to help you with the report setup, you can always get in touch with our consultants! They can help out in whatever you need or take over the entire process. Get in touch with us and let’s figure it out together.

If the customer does not come to you, have you ever considered going to the customer?

A website survey is, as the name suggests, a survey in your website, blog, online store, pretty much any HTTPS…

A website survey is, as the name suggests, a survey in your website, blog, online store, pretty much any HTTPS or WWW. Its purpose is to collect website feedback from your users, readers, customer, subscribers. In short, website surveys are perfect for collecting honest feedback from your target audience because they can find them when and where it’s relevant.

Website surveys are versatile since they take a multitude of forms, from pop-ups to embeds, and can be placed in different places in your site, depending on the pages you want to improve or need feedback on. Website surveys give you an excellent opportunity to learn why visitors visit your site, what they’d like to find, and assess their experience. So, stop guessing and start knowing.

Level up with website surveys 

Whether you want to understand your target audience or increase your conversion rate, forms are versatile tools that can help you get the insight you are looking for and need.

FEEDBACK
If you want to understand your visitor’s experience of your site, why not add a feedback survey to your website? You can feedback on your navigation, design, user-friendliness, content, and more. A survey like this would normally include questions like:

What brought you to our website? 
Where did you find our website? 
To what extent was it easy to find what you were looking for? 
If there is one thing you would like to change about our website, what would it be?

EXIT SURVEY
Conversion rate, the percentage of visitors who take the desired action, is a popular metric to assess growth. The desired action depends completely on your product/service and organization. For example, an online store’s conversion is a purchase, whereas for a social media platform it is creating an account.

If your conversion rate is low or you are not seeing a stable improvement, you can conduct an exit survey that activates after a certain amount of time. Such a survey can give you more insight into why your visitors are hesitating and not converting, and you can use that insight to increase conversions.

NET PROMOTER® SCORE
The NPS is an extremely popular metric to assess customer loyal and if you know us at all, you know it’s also an Enalyzer favorite. The NPS metrics consists of asking customers one question:

How likely is it that you would recommend this [company/product/service] to a friend or colleague?

Adding a permanent NPS survey to your site, for example, at the bottom of your page allows customers to send you continuous feedback.

FORMS
Feedback is fantastic, we work with it every day, we’re fans however, website surveys can do more than collect feedback. Is this an online store? Add an online order form. Do your customers need to book appointments? Add a booking form. Do you want to stay connected with your customers? Add a contact form.

Add surveys to your website today

Our website collectors make it incredibly simple to add a survey to your site and customize the respondents’ experience on your site. You can choose between embedding your survey, adding a button, or inserting a pop-up window. All you have to do is:

  1. Create and design your survey in your Enalyzer account 
  2. Head over to the share panel and select the website method 
  3. Select a collector and just copy/paste some code into your website.

Looking back at 2020: A Year in Review

Let’s be honest, 2020 has not been the best year. We started with the Australian fires and quickly found ourselves…

Let’s be honest, 2020 has not been the best year. We started with the Australian fires and quickly found ourselves in a global pandemic. COVID-19 has changed our lives and thrust us into a new normal and workplace revolution that we were not prepared for. Nevertheless, we are doing the best we can with the tools we have and Enalyzer wants to be part of this change

At Enalyzer, we have been working hard to bring you a platform that can help you connect with the new reality of your business. So, despite everything, let’s look back at 2020 features you might’ve missed.

TURN DATA INTO INSIGHTS

We’re always looking into ways for you to transform data into insights that will elevate your business and 2020 was not going to put a stop to that. This year we brought you two new chart types: Top/Bottom and Theme Overview.

TOP/BOTTOM CHARTS

Top/Bottom charts are brilliant for guiding readers and directing focus on what matters. Top/Bottom charts visualize the strongest and weakest data points which allow you to understand what is working and/or what needs improvement. You can supplement this by asking respondents which themes are most important to them, if any of them are part of the “bottom”, then you know where to direct reader focus.

Learn how to use this feature
→ Get inspired

THEME OVERVIEW CHARTS

Speaking of themes, surveys are often divided into themes that can consist of one or more questions. Usually, matrix questions will be used to cover a theme. For example, one matrix questions consisting of several sub-questions is there to measure feelings and opinions of the course leader. With Theme Overview charts, you can compare several themes in a single chart.


Learn how to use this feature

STRONGER ORGANIZATIONS

Organizations keep your company’s data in one place and protects it from employee turnover. As more of you were hoping over to organizations, we wanted to give them a serious upgrade in 2020 and give you an even better platform. Organization members can now share survey and report templates from within the platform, you can connect your contract with your organization and allocation contract plans among your employees and you can easily survey your organization employees.

ORGANIZATION TEMPLATES

We believe that the way to better insight is through collaboration, therefore, to save you precious time, organization members can share your surveys and related reports as templates that can be accessed by any organization member. No one has to start from scratch ever again.

Learn how to use this feature

AUTOMATIC ALLOCATION OF CONTRACT PLANS

Do you have a multi-user contract with us? Then this update is for you. Connect your contract to your organization and you’ll be able to automatically distribute contract plans amongst organization members. Once connected and the automatic allocation setting enabled, members that start using features that required a paid plan, will be automatically updated to one of the plans included in your contract.
Learn how to connect your contact to your organization
Learn how to automatically allocation contract plans

SEND RECURRING SURVEYS TO ORGANIZATION EMPLOYEES

Measure the employee experience requires consistency and this can be time-consuming. With our employee profiles and groups feature, you can empower your managers to collect and analyze feedback with just a few clicks. It’s easy, upload your employee information to your organization and invite employees to surveys directly from Enalyzer by using the stored data in their profiles, instead of manually setting up a CSV every time you conduct a survey.


Learn how to use this feature
Get inspired

YOUR WISH IS OUR COMMAND

We want to develop a platform that you see value in and get value from, therefore, we love receiving your feedback. But do you know what we love more? Making your wishes come true.

REPLACE BUTTON LINKS, IMAGES AND VIDEOS FOR REPORT VERSIONS

If your report has a video, image, or a button link in a text element, you are able to replace any of these for a specific version. In other words, your versions can have their own images, videos, and buttons depending on your needs. It’s perfect to contextualize your report versions, if they need their own videos or images because they are region/country/department-specific, you can now easily do that.
Learn how to use this feature

PRINT SURVEY

Probably one of our most requested features of all time. Print your survey and get an overview that you can share with teammates and managers.

ACCESSIBLE ENALYZER SURVEYS

At Enalyzer, our development team is always working on improving the experience for survey and report administrators, as well as respondents. Therefore, we’re excited to announce that Enalyzer surveys are WCAG 2.1 Compliant, in other words, we’ve made our surveys more accessible to respondents with disabilities.

Learn more about WCAG

The Solution to Workplace Sexual Harassment is Institutional Courage

The #MeToo movement has gone through different stages. Already back in 2006, it was kickstarted on Myspace by sexual harassment…

The #MeToo movement has gone through different stages. Already back in 2006, it was kickstarted on Myspace by sexual harassment survivor and activist Tarana Burke. However, it gained worldwide traction after the exposure of the sexual harassment allegations against Harvey Weinstein. Widespread media coverage led to high-profile firings as well as criticism and backlash, particularly in Hollywood. Nevertheless, thousands of stories largely shared by women have made it clear that sexual harassment is an issue in every industry.

The Center for American Progress divided sexual harassment charges from 2005-2015 by industry. The accommodation and food services industry, which includes restaurants, coffee shops, hotels, and other hospitality establishments, accounted for 14.2 percent of sexual harassment claims filed to the EEOC from 2005 to 2015. The retail industry accounted for an additional 13.4 percent of claims.

If that’s not enough, sexual harassment cases go largely unreported. The Equal Employment Opportunity Commission (EEOC) in 2016 found that 6 to 13% of individuals who experience harassment file a formal complaint. This means that 87 to 94% of individuals choose not the report the issue. The same goes for European countries, according to the report ‘Violence against women: an EU-wide survey‘ by the European Union Agency for Fundamental Rights.

Due to the overwhelming underreported cases of workplace sexual harassment, companies must be part of a cultural change to make it safer for employees to come forward. But where do you start?

INSTITUTIONAL BETRAYAL HAS TO BE MET WITH COURAGE

In 2014, Jennifer Freyd, a Professor of Psychology at the University of Oregon, coined two concepts, institutional betrayal, and institutional courage.

Institutional betrayal refers to the “wrongdoings perpetrated by an institution upon individuals dependent on that institution, including failure to prevent or to respond supportively to wrongdoings by individuals committed within the context of the institution”. Employees that report sexual harassment and are met with inaction are the victims of institutional betrayal. The good news is that Freyd also gives us the answer: institutional courage.

Institutional courage is meant to tackle institutional betrayal and it relies on accountability and transparency. It focuses on the anonymous collection of data, as well as the analysis of that data to develop new solutions.
There are 10 steps institutions can take to promote institutional courage to address workplace sexual harassment:

  1. Comply with criminal laws and civil rights codes, and go beyond minimal standards of compliance.
  2. Respond sensitively to victim disclosures and avoid victim-blaming responses.
  3. Be accountable for mistakes and apologize when appropriate.
  4. Cherish and encourage whistleblowing.
  5. Monitor your organization regularly to ensure that you are not promoting institutional betrayal.
  6. Conduct anonymous surveys to get meaningful insights and talk openly about the findings.
  7. Make sure leadership is educated about research on sexual violence and related trauma.
  8. Be transparent about data, processes, and policies regarding workplace sexual harassment.
  9. Use the power of your company to address the societal problem, e.g. if you’re in the entertainment industry, make films that inform the public about sexual violence.
  10. Commit resources to steps 1 through 9. Ensure that there is staff, money, and time dedicated to address sexual harassment and change the culture.

YOU CAN’T CHANGE WHAT YOU DON’T MEASURE

When an employee files a sexual harassment complaint, you have a legal, ethical, moral, and employee relations obligation to investigate the charges thoroughly and without delay. However, since sexual harassment goes largely unreported, the lack of complaints does not indicate a healthy and safe work environment.

MEASURE SEXUAL HARASSMENT IN YOUR WORKPLACE ACCURATELY

In recent years, more and more companies have opted for measuring sexual harassment in the workplace, which is great! Nevertheless, your methodology needs to be spot on or you risk not getting an accurate picture. Research shows that if you ask the direct and single question:

Have you been exposed to unwanted sexual attention in your workplace within the last 12 months?

You will get a low percentage that will not reflect the real extent of sexual harassment in your workplace. The reason is that that question is often perceived by employees as a physical, sometimes violent, form of sexual harassment.

If #MeToo has taught us something is that sexual harassment and unwanted sexual attention take many forms and you should be measuring them to get the whole picture. We have developed a solution that addresses concrete forms of sexual harassment, physical and verbal, which will give you a complete understanding of sexual harassment in your workplace.

view survey

Furthermore, for those who have experienced one or more types of sexual harassment, it’s important you also measure the frequency of the sexually abusive behavior, as well as find out who the perpetrator was: manager, colleague, or customer. With all this information, you can get a holistic understanding of the extent of sexual harassment in your workplace.

YOU NEED TO FOLLOW UP AND TAKE ACTION

The measurement itself can take place in connection with the annual employee survey. However, we recommend that the reporting and follow-up on sexually abusive behavior take place in an independent setting, where the focus is only on sexually abusive behavior. For example, do not have team or employee meetings to discuss engagement and sexual harassment, keep sexual harassment separate.

Following up on the results will cause employees to reflect on their behavior in the workplace, as well as create safety for victims which will be more inclined to come forward with complaints.

ENCOURAGE WHISTLEBLOWING

We have established that sexual harassment is grossly underreported. Therefore, people that decide to raise uncomfortable truths need to be championed. We developed a whistleblower solution that encourages people to report what they’ve experienced in a safe, yet easy way.

HOW DOES IT WORK?

  1. Make sure that all your employees have access to the form.
  2. Set up a QR code that takes employees to the complaint form

Employees can decide whether or not they want to remain anonymous.

This whistleblower solution sends a clear message to your employees, that your company takes their safety seriously and will not tolerate sexual harassment. Furthermore, the complaints work as a preventive measure for perpetrators.

view form

Go ahead and set these up yourself and ensure the safety of your employees. We can also help you set it up or take over completely.

Interested? Book a demo.

The value of transactional surveys for your customer experience

Every time a customer interacts with your company, whether it’s an online purchase or a conversation with your customer success…

Every time a customer interacts with your company, whether it’s an online purchase or a conversation with your customer success team, it’s a chance to measure the quality of that experience. These interaction measurements are known as transactional surveys.

Transactional surveys measure the experience a customer has had within a particular transaction or interaction with your organization/brand, also known as a touchpoint. This type of survey is designed to measure the customer experience with a specific company segment in order to understand and improve it. 

Chances are you are already familiar with transactional surveys. They tend to include questions like:

  • How would you rate your experience with our support team?
  • How satisfied were you with your purchasing experience?
  • On a scale from 1-5, to what extent do you agree with the following statement? It was easy for me to find what I was looking for.

In short, transactional surveys help you gauge your performance across multiple touchpoints.

If you don’t have the resources to survey the touchpoints that impact the customer experience, consider conducting a survey that measures the experience and assess the touchpoints that need critical attention.

It’s important to send transactional surveys as soon as possible after an interaction. Given that the interaction is still fresh, customers are more likely to answer your survey.

Beware of sending them too often. A customer that has to call a support center two or three times in a week isn’t going to like being surveyed after each interaction. Instead send them a survey after their case has been solved.

Furthermore, define the boundaries of the touchpoint. For example, if you want to measure the purchasing experience, you might want to send the survey after the item has arrived and not after the purchase.

Types of Transactional Surveys

The most common types of transactional surveys are Net Promoter Score (NPS), Customer Effort Score (CES), and Customer Satisfaction (CSAT) metrics.

Transactional CSAT surveys

Customer Satisfaction (CSAT) surveys are the classic transactional survey. As the name suggests, they measure a touchpoint’s satisfaction. For example:

  • How satisfied were you with your customer support?
  • How satisfied were you with your purchase?
  • How satisfied were you with the demo?

Customer satisfaction surveys are an easy and straightforward way to gauge your touchpoint experience. They should be sent to your customers immediately or a few days after the interaction or product delivery.

Transactional CES surveys

Developed in 2011, the Customer Effort Score (CES) measures the ease of a customer’s experience with the statement: [Company] made it easy for me to handle my issue. Customers mark whether they “strongly disagree” or “strongly agree” on a scale from 1 to 5.

You can adapt the CES question to the relevant touchpoint, for example:

  • The support agent made it easy for me to resolve my issue.
  • It was easy to find what I was looking for.
  • The video tutorial made it easy for me to resolve my issue.

CES surveys should be delivered directly after the interaction to gauge the amount of effort.

Transactional NPS surveys

In case you’re not familiar with the Net Promoter Score®, it’s a metric developed in 1993 by Fred Reichheld as a way to measure customer loyalty.

The NPS is based on a single and simple question on a 0-10 scale: “How likely is it that you would recommend this [company/product/service] to a friend or colleague?” 

Respondents are segmented into three groups according to the rating they gave:

  • Promoters (score 9 – 10) are loyal and will recommend you to their networks. They are your ambassadors and are therefore more likely to remain customers and increase their purchases over time.
  • Passives (score 7 – 8) are satisfied for now but your company, product and/or service didn’t leave a lasting or permanent impact. They won’t vouch for you but may mention you within the right context.
  • Detractors (score 0- 6) are not happy! They will actively spread negative word-of-mouth and tend to be louder (and scarier) than promoters.

The NPS ranges from -100 to 100 and it can be seen as a report card for your company, product or service, grading the overall customer experience. To calculate the score, subtract the percentage total of Detractors from the percentage total of Promoters—this is your NPS.

The NPS can be used a transactional survey for a specific interaction. A transactional NPS survey question would be phrased: “Based on your most recent [experience/transaction], how likely are you to recommend [company/product/brand]?”

Automation is your friend

With our multiple question types, which include the NPS question you can build engaged and powerful surveys, you can build any and all transactional surveys.

However, when it comes to transactional surveys what you need is automation. As covered previously, transactional surveys provide you with actionable data. To be able to act upon this data, you need the data to come to you, instead of you to it. In other words, let the tech do the manual labor so you can focus on elevating your customer experience.

Our categories and notifications features will do the trick. Categories allow you to filter through your respondents based on their answers, for example, filter everyone that is satisfied with your customer support. You can enable notifications for categories, which means you’ll receive an email when incoming responses match your category, e.g. you can be notified every time a respondent is dissatisfied with the touchpoint you’re measuring.

The results

With our frequency charts, you can quickly gauge an average score for the touchpoint your measuring. Nevertheless, the power of transactional surveys, it’s the development over time since it allows you to quickly identify trends and quantify the effects of new initiatives. You can do this with time series charts.

Time series charts allow you to track variables over time and quantify whether changes you make to your product or service affect the customer experience. This enables you to figure out what works and what doesn’t and allows you to address concerns immediately. For example, if your customers are experiencing bugs related to a recent feature release, this might reflect negatively on your customer’s support NPS. Tracking your NPS will reflect this and show that the problem is not necessarily related to your support agents but to the unexpected bugs. Consequently, your strategy will be focused on improving feature releases instead of wasting resources in adding support agents.

You can also add benchmarks to your charts and compare different segments. For example, if you measure customer experience with your software demos, you can compare the performance of the different sales agents.

The Future of Work Has Arrived. Are You Technologically Ready For It?

The COVID-19 worldwide lockdown has led to a radical change in the use of technology and expanded remote working possibilities….

The COVID-19 worldwide lockdown has led to a radical change in the use of technology and expanded remote working possibilities. This has meant that the workplace of the future has already moved into many organizations in the form of increased digitalization and working from home. Many organizations are following up on the experiences of working remotely. The preliminary results show that many organizations have experienced a significant decrease in sick leave, for example, sick leave has decreased by 64% at the Danish Safety Technology Authority

The economic benefits of reducing sick leave are palpable. Last year, the Confederation of Danish Employers estimated that sick leave costs society DKK 46 billion annually. We’re not talking about small change here. Private companies and public organizations can save significantly by reducing sick leave.

There are two primary reasons for the decline in sick leave during the current COVID-19 pandemic. First and foremost, the general population has a much greater focus on hygiene to decrease the spread of the coronavirus. We all know the authorities’ hygiene advice:

  1. Wash hands frequently or use hand sanitizer
  2. Cough or sneeze into your sleeve
  3. Avoid handshakes, kisses, and hugs
  4. Pay attention to cleaning, at home and work
  5. Keep your distance and ask others to be considerate

The second reason is remote work. The widespread of remote work has given many families a more flexible working life instead of the constraints of a 9 to 5 schedule. The increased flexibility has made it easier to balance work and personal/family life. Unquestionably, all other things being equal, many now feel less stressed in everyday life, which in turn means that the probability of sick leave decreases. In short, the first results show that an increase in remote work reduces stress and sick leave. But three things need to be in place to reap the benefits of an increased in remote work without compromising the organization’s productivity:

  1. You need to have a handle on your tech. Employees need to have the same access to IT systems and relevant tools at home as they do at the office.
  2. Your employees need to be equipped to take advantage of new technological opportunities and that they feel familiar with the application of the new technology and tools.
  3. As employees will using 40% of their time working from home, you need to ensure that work processes and routines around the technology are thought into their everyday lives. You have to be aware of whether the current processes around the technology need to be adjusted to the new reality.

Is your organization technologically ready for remote work?

It’s important to examine the technological readiness of your organization to ensure employee productivity when they’re working from home. We’ve made a test that can give you a quick assessment.

Take the test

However, if you’d like a thorough evaluation of all levels of your organization, we can take care of that as well. Contact us and have a personalized technological readiness assessment within two weeks.

Our consultants are ready to help you and set up a live report.

COVID-19: Ensure the safety of your customers with a contact tracing system

Lockdowns and restrictions continue to ease around the world, which means restaurants, concert halls, stores, and other facilities are finally…

Lockdowns and restrictions continue to ease around the world, which means restaurants, concert halls, stores, and other facilities are finally open. However, the reopening has come with its challenges and restrictions. And now governments in many countries have encouraged or even required for all publicly accessible facilities and event venues to record people’s contact details and assist with tracing efforts.

With Enalyzer, you can easily set up a tracing system that’s efficient and most importantly safe. Quickly gather guest and customer contact details and notify them if there has been a risk of infection at your venue.

How does it work?

Scan and register

Create and design your registration form. Get the QR code, print it, and place it somewhere visible in your restaurant, store, or company. When guests and customers scan the QR code, they’ll be directed to a registration form where they’ll enter their contact details. Most smartphones already have a QR code reader integrated into the camera and therefore don’t need to download an app.

Test the QR code by using your smartphone camera

Collect registrations

With Zapier, you can automatically transfer your data from Enalyzer to whatever app you choose to collect the registrations. We recommend a spreadsheet app such as Google Sheets, Smartsheet, and Airtable.

You’ll be able to register contact details as well as the time and date of their visit, so you have all the information you need to keep our customers and guests safe.

Notify affected customers

In the event of an infection suspicion, you can easily and quickly inform the guests that were at your venue at the respective time window and message them. With Zapier, you can automate the entire process of sending out emails.

If necessary, you can simply export the potentially affected groups and forward them to the relevant authorities.

As with everything, you can set it up yourself or we can do it for you. Our team is ready to set up a contract tracing solution that fits every single one of your needs. Interested? Book a demo.

Security and GDPR

Personal data should always be approached with safety and care, especially since it lands you in the realms of GDPR. Therefore, you should consider the following:

Registration must be voluntary

You cannot require or force customers and guests to register their information, it must be voluntary. In short, there should be no inconvenience or consequence to the customer or guest if they reject registering their information.

State your purpose

Customers and guests must know what is being registered, what it be used for, and for how long it will be stored. You don’t need to store the information for more than a couple of weeks. If you already have a personal data policy, consider adding a section about the registration. Enalyzer is GDPR compliant and we do our utmost to keep your data safe. Our consultants ensure security and GDPR compliance for all of our solutions.

Collect only what you need

This will usually include name, email, phone number date, and time the customer or guest has been at the location. Depending on the size of the venue, you can also register which floor or side of the venue the guest has been in, as this information can also be relevant and helpful in tracing the infection.

Secure the information

Make sure that unauthorized people don’t access the registered information and don’t use the information for anything else than people have consented to. The information may only be used for contract tracking.

Delete continuously

When the information is no longer relevant, it must be deleted. According to the authorities there is a 14-day incubation period for coronavirus infection, it must therefore be assumed that you are probably not allowed to store personal information for longer than two weeks.